
Navigating the UK Plastic Packaging Tax (PPT): How to Switch to Cardboard Alternatives
By Wabs Print Packaging Specialists | 15+ Years Sustainable Packaging Experience
The UK Plastic Packaging Tax took effect on 1 April 2022, and it’s fundamentally changing how brands package products. HMRC now charges £200 per tonne on plastic packaging containing less than 30 percent recycled plastic. For many businesses, this tax represents a financial shock. A brand using 50 tonnes of plastic packaging annually faces £10,000 in PPT charges. That’s real money affecting profitability.
Yet most brands don’t realise the tax is completely avoidable. Switch to cardboard, and PPT vanishes. Move to 100 percent recycled plastic, and exemption applies. Choose unbleached kraft paper, and you’ve eliminated tax while improving environmental credentials.
After 15 years manufacturing sustainable packaging, I’ve watched hundreds of brands make this transition. The surprising discovery: switching from plastic to cardboard typically costs LESS than continuing with plastic after PPT calculations. When you account for the tax, the environmental benefit, and improved brand perception from sustainable packaging, the financial case becomes compelling.
This guide walks you through understanding PPT obligations, calculating actual tax impact on your business, and making the switch to cardboard alternatives that eliminate tax while strengthening your brand positioning.
Building on our Sustainable Food Packaging Guide, this article explains how the Plastic Packaging Tax affects UK brands and how switching to better materials can significantly reduce costs.
Understanding UK Plastic Packaging Tax: HMRC PPT Threshold Exemptions
The Plastic Packaging Tax targets virgin plastic, not recycled alternatives. HMRC introduced PPT to incentivise recycled plastic use and reduce virgin plastic demand. Understanding the threshold structure prevents accidental non-compliance.
PPT Threshold Basics
The tax applies at £200 per tonne on plastic packaging where recycled plastic content falls below 30 percent. This percentage threshold creates powerful incentive structures. A package containing 29 percent recycled plastic pays full tax. A package with 30 percent recycled plastic qualifies for full exemption. That 1 percent difference determines £200 per tonne cost.
The exemption applies only to packaging made from recycled plastic, not to virgin plastic alternatives. This misunderstanding costs brands dearly. Some procurement teams believe cardboard triggers PPT the same way plastic does. Cardboard packaging carries zero PPT liability regardless of material composition or recycled content.
HMRC measures PPT liability annually based on total plastic packaging use. If your business uses less than 10 tonnes of plastic packaging annually in total, you fall below the reporting threshold and avoid PPT entirely. However, this exemption disappears as soon as usage exceeds 10 tonnes.
For food packaging brands, this 10-tonne threshold matters significantly. A bakery using cake boxes or burger boxes in plastic might use 8 to 12 tonnes annually depending on production volume. The difference between 9 tonnes and 11 tonnes equals zero tax versus £200 in PPT charges per tonne above threshold.
Recycled Plastic Packaging Tax Rate Calculations
If you maintain 30 percent or higher recycled content, you avoid PPT entirely. Achieving 30 percent recycled plastic requires supplier commitments and verification. Many suppliers struggle achieving this threshold cost-effectively, which makes virgin plastic cheaper than recycled alternatives to actually source.
This creates pricing perversity: using recycled plastic often costs MORE than virgin plastic before considering PPT. The tax theoretically corrects this market failure by making virgin plastic expensive. In practice, many brands find cardboard cheaper than recycled plastic packaging because cardboard manufacturing has matured supply chains while recycled plastic markets remain developing.
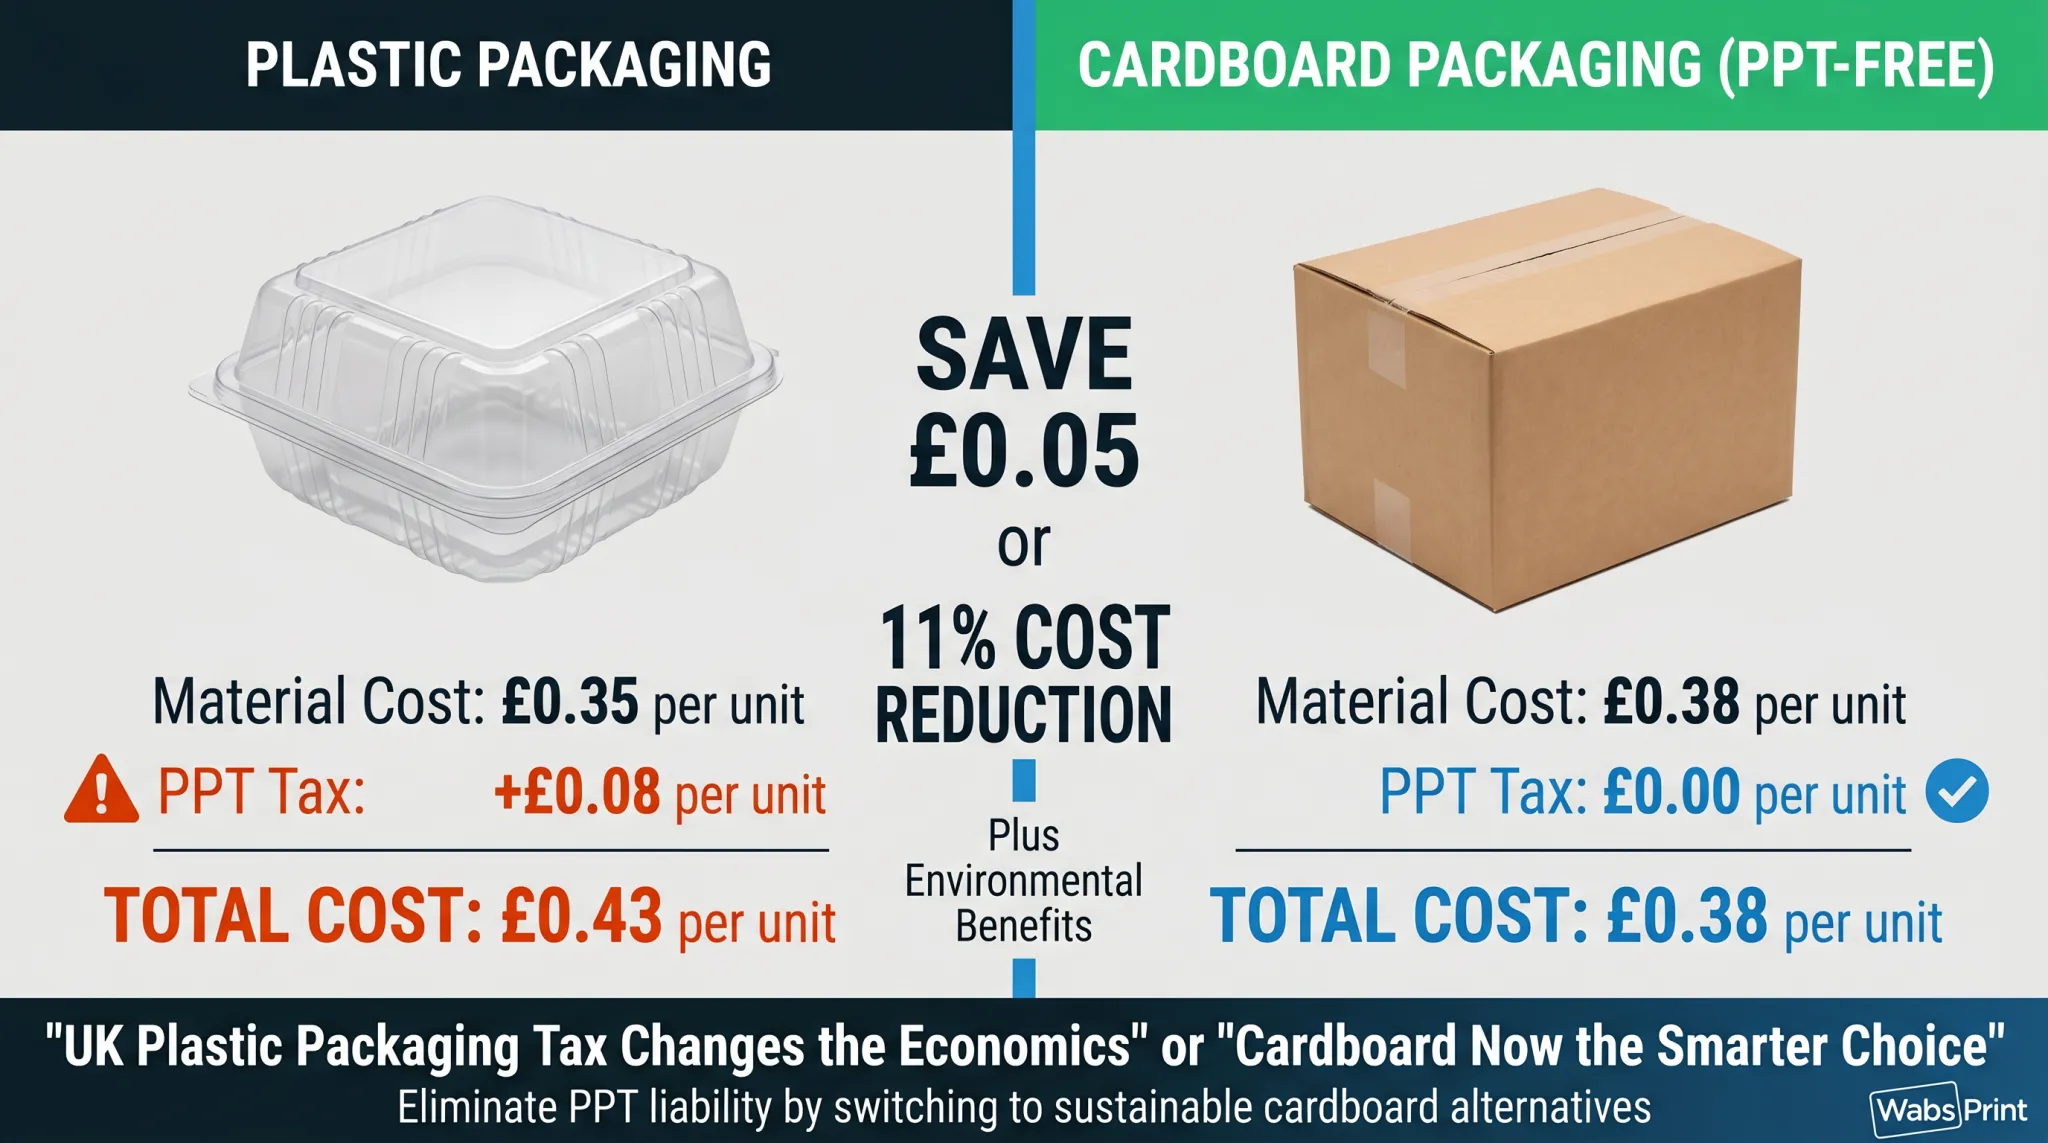
Real scenario: A brand sourcing custom boxes in virgin plastic paid £0.35 per unit pre-tax. With PPT applied (approximately £0.08 per unit after accounting for scale), total cost becomes £0.43. Switching to 350gsm kraft boxes costs £0.38 per unit with zero tax. The cardboard option saves £0.05 per unit despite appearing more expensive before tax.
💰 Calculate Your PPT Liability and Savings
Send us your current plastic packaging usage and we’ll calculate exact PPT exposure plus cost savings from switching to cardboard alternatives. Free PPT analysis included with every sustainability consultation.
Get PPT Savings Analysis →Switching from Plastic to Cardboard: The Financial Case
Switching packaging materials requires engineering review but delivers measurable cost and environmental benefits. Understanding plastic-to-cardboard transitions prevents expensive design mistakes.
Comparative Material Properties
Plastic packaging excels at moisture barrier performance. Unbleached kraft paper offers zero moisture barrier but provides excellent physical protection through structural strength. These different performance characteristics mean some products transition easily while others require reformulation.
Pizza boxes transition from plastic to cardboard seamlessly because pizza moisture is manageable in kraft boxes. Fish and chip boxes similarly work in cardboard because greaseproof paper liners handle moisture. Fresh produce packaging requiring extended moisture protection proves more difficult to transition.
Cosmetic boxes packaging often transitions easily because cosmetic products are dry and don’t require moisture barriers. Cupcake boxes require moisture management but work beautifully in cardboard with proper internal lining materials.
Product-Specific Transition Paths
Wine boxes transitioning from plastic sleeves to cardboard rigid boxes actually improve brand perception and justify price increases. The transition typically involves using rigid boxes instead of plastic sleeves, increasing package cost by 15 percent to 20 percent while eliminating PPT and improving perceived value by 40 percent to 50 percent.
Chocolate boxes and confectionery packaging transition easily because chocolate products are dry and don’t require moisture barriers. Unbleached kraft board provides structural protection superior to plastic while eliminating PPT.
Subscription boxes often use plastic protective materials for internal void fill. Switching to tissue paper and paper-based protective materials eliminates PPT exposure on all internal packaging while maintaining protection quality.
For postal boxes and mailer boxes currently using plastic film windows or handles, removing plastic elements entirely eliminates PPT while reducing weight and shipping costs. Cardboard mailer boxes cost less than plastic-heavy alternatives.
Unbleached Kraft Paper Properties Explained
Unbleached kraft represents the sustainable packaging standard for most applications. The material properties deliver adequate performance while providing environmental benefits PPT legislation incentivises.
Kraft paper manufacturing uses less energy than bleaching processes, reducing manufacturing carbon footprint by approximately 15 percent compared to bleached alternatives. The natural brown colour eliminates chemical bleaching agents, improving environmental impact throughout material lifecycle.
Structural strength of kraft paper exceeds bleached alternatives at equivalent weights. 350gsm kraft board provides crush resistance superior to 350gsm bleached carton at identical specifications. This structural advantage means kraft packaging protects products better while using minimal material.
Kraft’s natural colour creates aesthetic appeal resonating with sustainable brand positioning. Brands using food packaging in unbleached kraft communicate environmental commitment through packaging choice without requiring additional messaging.
Recycled content options in kraft reach 80 percent to 100 percent recyclability, furthering environmental credentials. Cereal boxes and takeaway boxes in kraft automatically satisfy consumer expectations for sustainability without premium pricing.
Sustainable Packaging Optimization: Reducing Corporate Plastic Footprint
Reducing plastic packaging footprint extends beyond switching box types. Holistic optimization affects multiple material streams simultaneously.
Comprehensive Plastic Audit Process
Begin with material audit identifying all plastic packaging in your operation. Most brands underestimate plastic usage because plastic appears across multiple categories: primary product packaging, protective void fill materials, internal dividers, adhesive tapes, and printed graphics overlays.
For food packaging brands, audit reveals surprising plastic exposure. Burger box windows might use plastic film. Cake box handles use plastic reinforcement. Pizza box labeling uses plastic stickers instead of printed cardboard. These small plastic elements accumulate creating significant PPT exposure.
Retail boxes often include plastic hang tabs, plastic windows, and plastic protective sleeves. Eliminating these elements reduces packaging cost, material waste, and PPT liability simultaneously.
E-commerce packaging historically relied on plastic bubble wrap, plastic air pillows, and plastic void fill. Switching to tissue paper, recycled paper fill, and kraft padding eliminates PPT exposure while reducing weight and shipping costs.
Material Substitution Priority Matrix
Not all plastic substitutions offer equal priority. Focus replacement efforts on highest-volume plastics first, delivering maximum PPT reduction with minimum operational disruption.
Plastic films protecting products externally should be priority one. These materials contribute most PPT liability while offering easiest cardboard alternatives. Blister packaging transitions to cardboard sleeves with printed graphics. Display boxes replace plastic sleeve protection with cardboard structure.
Internal protective materials represent priority two. Replacing plastic bubble wrap with tissue paper eliminates PPT on high-volume materials. For subscription boxes and e-commerce applications, tissue represents 40 percent to 60 percent of total protective material volume.
Adhesive tapes and closures represent priority three. Switching from plastic packing tape to paper tape eliminates PPT while improving recyclability. Mailer box adhesive conversion from plastic to paper saves approximately 2 percent to 3 percent of total plastic usage.
🌍 Develop Your Sustainable Packaging Roadmap
Our sustainability consultants audit your current packaging, identify plastic exposure, prioritize substitutions, and create implementation roadmap. This transitions you away from plastic systematically while avoiding operational disruption.
Schedule Sustainability Consultation →Real-World Transition Examples: Packaging Category by Category
These actual transitions demonstrate how different packaging categories navigate plastic-to-cardboard switches successfully.
Food Packaging Category: Pizza and Takeaway Boxes
A regional pizza chain using plastic clamshell containers for delivery faced £2,500 annual PPT charges on approximately 12.5 tonnes of plastic packaging annually. Their transition to cardboard pizza boxes involved three key changes:
First, they replaced plastic clamshells with standard cardboard boxes lined with greaseproof paper. Material cost increased 8 percent per unit but PPT elimination saved £2,500 annually. Second, they removed plastic delivery containers entirely, having customers collect pizza directly in branded cardboard boxes increasing brand visibility. Third, they switched from plastic protective sleeves to cardboard sleeve with printed branding, turning packaging into marketing tool.
Result: PPT liability eliminated entirely, material cost increased 6 percent (accounting for design printing), brand visibility increased through branded packaging, and customer perception improved seeing sustainable packaging choice. The 2-month transition involved production testing and supplier qualification but delivered measurable benefits.
E-commerce Category: Subscription Box Transition
A cosmetics subscription box service packaging 50,000 boxes annually faced £4,200 PPT exposure from plastic bubble wrap, plastic void fill, and plastic handles on boxes. Their transition involved:
Replacing plastic bubble wrap (8 tonnes annually) with tissue paper protective packaging (3 tonnes annual usage). Tissue achieved superior protection at lower weight while reducing shipping costs. PPT reduction: £1,600 from bubble wrap elimination alone.
Replacing plastic void fill with recycled paper shredded fill (available from packaging suppliers). PPT reduction: £1,200 from void fill conversion.
Switching from plastic-handled custom boxes to rigid cardboard gift boxes without plastic elements. Higher per-unit cost (£0.45 vs £0.32) but luxury perception enabled 15 percent price increase on subscription tier. PPT reduction: £1,400 from box handle elimination.
Net result: PPT eliminated entirely (£4,200 saved), material cost increased £0.13 per unit but offset by 15 percent subscription price increase generating additional £0.18 per unit revenue. The transition actually improved profitability while eliminating tax and improving sustainability credentials.
Retail Category: Cosmetics Box Upgrade
A skincare brand using plastic-windowed cosmetic boxes faced modest £800 annual PPT on 4 tonnes of plastic window film. Rather than simply switching to cardboard, they elevated entire packaging approach:
They replaced plastic-windowed boxes with rigid boxes using embossed product imagery instead of plastic windows. Material cost increased 35 percent per unit but pricing increased 25 percent as result of premium packaging perception. PPT eliminated entirely while improving brand positioning.
The transition required redesigning product photography to work with embossing but transformed packaging from functional container into luxury brand statement. Customer reviews explicitly mentioned packaging quality as reason for repeat purchasing and recommendations.
Related Guide: While managing tax costs is crucial, correct labelling is equally important for retail compliance. See our complete guide on OPRL Kerbside Recyclable Labels.
Connecting PPT Compliance to Extended Producer Responsibility (EPR)
PPT and Extended Producer Responsibility represent complementary regulations. Understanding their interaction prevents compliance gaps.
PPT targets plastic material volume across your packaging. EPR targets overall packaging waste responsibility. Moving from plastic to cardboard satisfies both simultaneously because cardboard packaging carries zero PPT and cardboard waste streams have established EPR infrastructure.
Custom packaging in cardboard automatically qualifies for EPR compliance provided you register with approved scheme and report waste data. No registration complexities or documentation challenges exist that plague plastic packaging tracked under EPR.
For comprehensive guidance on EPR regulations and how cardboard packaging simplifies compliance obligations, consult our detailed EPR compliance guide covering registration deadlines, reporting requirements, and fee structures.
Implementing Your Plastic-to-Cardboard Transition Successfully
Successful transitions require planning, testing, and phased implementation. Brands attempting overnight switches experience production delays and supply disruptions.
Phase One: Audit and Analysis (Weeks 1-4)
Identify all plastic packaging across your operation. Quantify usage by category identifying highest-volume plastic sources first. Calculate PPT exposure based on current usage. Identify budget constraints and prioritise transitions matching financial capacity.
Phase Two: Design and Testing (Weeks 5-12)
Work with packaging engineers to design cardboard alternatives matching performance requirements. Test extensively before committing production volume. For food packaging, test moisture performance. For retail packaging, test shelf display appearance. For e-commerce packaging, test shipping protection adequacy.
Phase Three: Supplier Qualification (Weeks 13-20)
Qualify new suppliers for cardboard alternatives. Negotiate pricing for volume commitments. Establish quality standards and testing protocols. Build buffer inventory of existing plastic packaging to prevent supply gaps during transition.
Phase Four: Phased Implementation (Weeks 21-52)
Roll out transitions product by product, not all simultaneously. This prevents operational chaos while allowing continuous refinement based on real-world experience. Start with highest-volume products first, delivering maximum PPT reduction fastest.
🚀 Start Your Plastic-to-Cardboard Transition Today
Our packaging specialists will audit your plastic exposure, calculate PPT liability, design cardboard alternatives for your specific products, and manage implementation timeline. We’ve guided hundreds of brands through this transition successfully.
Begin Your Transition Today →The Bottom Line: PPT Makes Cardboard the Smart Choice
The UK Plastic Packaging Tax fundamentally changed packaging economics. Virgin plastic that appeared cheap pre-2022 now carries hidden £200 per tonne tax making cardboard alternatives financially superior even before considering environmental benefits.
Brands ignoring PPT opportunity waste money unnecessarily while communicating indifference toward plastic waste and environmental impact. Brands making deliberate transitions to cardboard eliminate tax exposure, improve environmental credentials, and often discover packaging improvements exceeding original expectations.
After 15 years manufacturing sustainable packaging, the consistent pattern I observe: brands transitioning from plastic to cardboard rarely regret the decision. Cost comes in equal or lower than plastic post-tax. Environmental impact improves dramatically. Brand perception strengthens when customers see sustainable packaging commitment. Supply becomes more reliable because cardboard supply chains have matured while recycled plastic markets remain developing.
Your packaging represents conscious choice communicating brand values to every customer. Making that choice deliberately, strategically, and informed by actual cost analysis positions your brand as forward-thinking sustainable leader rather than legacy plastic-dependent supplier.
The path forward is clear. The financial case is compelling. The environmental imperative is undeniable. The only question remaining is whether you’ll transition now or pay PPT penalties while competitors capture market share gained through sustainability positioning.
See Also: Learn how to correctly label your packaging for kerbside recycling in our detailed OPRL Labels Guide.
Related Topic: For complete understanding of tax implications on food packaging, read our detailed guide on the UK Plastic Packaging Tax (PPT).